

Understanding K-Means

Course Lessons
| S.No | Lesson Title |
|---|---|
| 1 | Introduction |
| 1.1 | Applications of Clustering in Real-World Scenarios |
| 2 |
Properties of Clusters |
| 2.1 | Property 1 |
| 2.2 | Property 2 |
| 3 |
Introduction to K-Means CLustering |
| 3.1 | Step 1 |
| 3.2 | Step 2 |
| 3.3 | Step 3 |
| 3.4 | Step 4 |
| 3.5 | Step 5 |
| 3.6 | Stopping Criteria for K-Means Clustering |
| 4 |
K-Means++ |
| 4.1 | Steps to Initialize |
| 5 |
Implementing K-Means Clustering in Python |
| 5.1 | Exploratory Data Analysis |
| 5.2 | K-Means |
| 5.3 | Finidng Optimum Clusters |
| 6 |
Conclusion |
Introduction
Let's say that we have a dataset where each example has a certain number of features but has no labels. The most important task that we can do on a dataset that does not have labels is to find the data elements of nature and forming a groiup. These are called clusters. K-Means is one of the most popular clustering algorithms. In K-Means we store k-centers which define our clusters. A point is considered to belong to a particular cluster if it is closer to that cluster's center than any other center.
K-Means finds the best centers for every single point in our dataset by going back and forth between (1) assigning data points to clusters based on the current centers (2) choosing centers based on the current assignment of data points to clusters.
Applications of Clustering in Real-World Scenarios
- Customer Segmentation
- Document Clustering
- Image Segmentation
- Recommendation Engines
Properties of Clusters
Let's understand the properties of clusters using the example of the below dataset. In this dataset, we have to predict where a person will get a loan or not.
| Loan_ID | Gender | Married | Applicant_Income | Loan_Amount | Loan_Status |
|---|---|---|---|---|---|
| LP001002 | Male | No | 5849 | 130.0 | Y |
| LP001003 | Male | Yes | 4583 | 128.0 | N |
| LP001005 | Male | Yes | 3000 | 66.0 | Y |
| LP001006 | Male | Yes | 2583 | 120.0 | Y |
| LP001008 | Male | No | 6000 | 141.0 | Y |
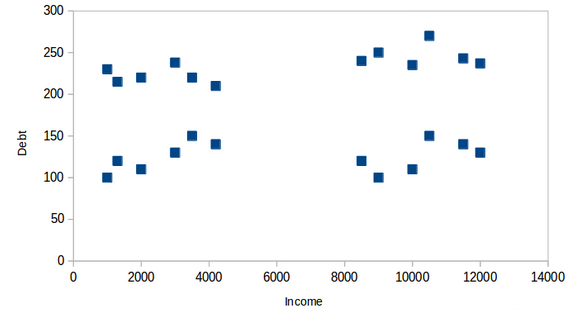
Here we can see that on the x-axis we have income and on the y-axis we have debt. In the below diagram we can clearly see the four clusters formed.
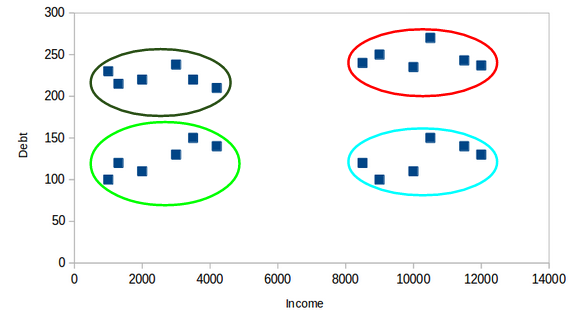
Property 1
All the points belonging to a particular cluster should be similar to each other.
Property 2
The points of different clusters should be as different as possible.
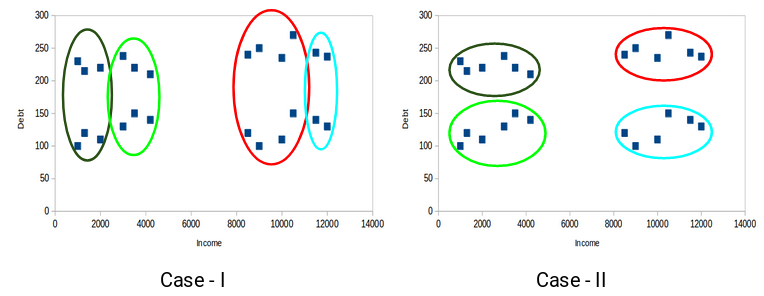
Here we have 2 different clusters. In case 1 the clusters are not much apart. This means that the data points are a bit similar in case 1. But in case 2, the clusters are as far apart as possible. This means that the bank would be able to target customers better in case 2.
Introduction to K-Means Clustering
K-Means is a centroid-based algorithm, in which we calculate the distance of each point from every cluster and assign the point to the cluster which is the closest. The aim of K-Means is to minimize the sum of distances between the points and their respective cluster centers.
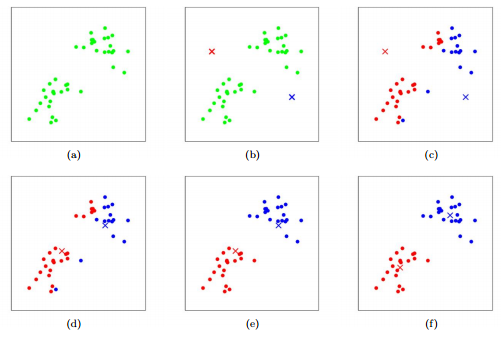
Let us now understand how K-Means works with the help of an example:
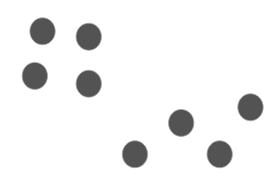
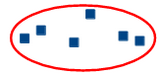
Here we have 8 data points and we want to apply K-Means so that we can make clusters for these points. Below are the steps that we need to perform in order to apply K-Means on these points.
Step 1
Choose the number of clusters.
The first step in performing K-Means is that we need to choose the number of clusters, k.
Step 2
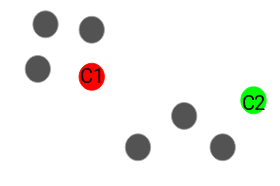
Select k random points from the dataset to make them cluster centers.
After selecting the number of clusters we will make, we have to select any k random points in our dataset and make them our cluster centers. Let's say k is 2.
Step 3
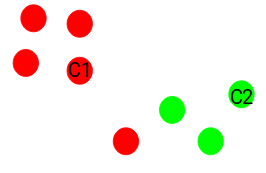
Assign all the points to the closest cluster centroid
Once we have initialized the centroids, we assign each point to the closest cluster centroid
Step 4
Re-compute the centroids of newly formed clusters
Now, once we have assigned all of the points to either cluster, the next step is to compute the centroids of newly formed clusters.
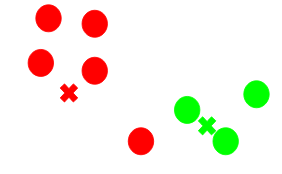
Here, the red and green crosses are the new centroids.
Step 5
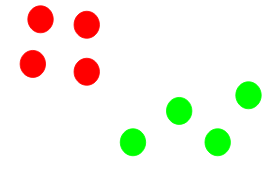
Repeating steps 3 and 4
We then repeat steps 3 and 4.
Stopping Criteria for K-Means Clustering
Below are the three stopping criteria for stopping K-Means:
- Centroids of newly formed clusters do not change
- Points remain in the same cluster
- The maximum number of iterations are reached
K-Means++
K-Means is very sensitive to center initialization. If the cluster center initialization is not appropriate then the clustering is not appropriate. In some cases, the cluster center can get stuck in local minima, and then inappropriate clusters will be formed. This is where K-Means++ helps. K-Means++ gives a method to initialize the cluster centers before moving forward with the standard K-Means clustering algorithm.
Steps to Initialize
The steps to initialize the cluster centers using K-Means++ are:
- The first cluster is chosen uniformly at random from the data points that we want to cluster.
- Now, we compute the distance of each data point from the cluster center that has already been chosen.
- Then, we choose the new cluster center from the data points with the probability of the data point being proportional to the square of the distance of the data point from the cluster center.
- We then repeat steps 2 and 3 until k clusters have been chosen.
The K-Means library in sklearn uses K-Means++ for initializing the cluster centers.
Implementing K-Means Clustering in Python
Now we will see a demo of the K-Means algorithm. In this problem, we will be working on a wholesale customer segmentation problem. The goal of this problem is to divide the clients of a wholesale market on the basis of their annual spending on different product categories, like grocery, milk, etc.
Exploratory Data Analysis
We will first import the required libraries:
# Here we are importing all the required libraries
import pandas as pd
import numpy as np
import matplotlib.pyplot as plt
%matplotlib inline
from sklearn.cluster import K-Means
Next, let us look at the data of the first five rows:
# Here we are reading the csv file using pandas and storing it in a variable called data.

data=pd.read_csv("Wholesale customers data.csv")
data.head()
Output:
| Channel | Region | Fresh | Milk | Grocery | Frozen | Detergents_Paper | Delicassen | |
|---|---|---|---|---|---|---|---|---|
| count | 440 | 440 | 440 | 440 | 440 | 440 | 440 | 440 |
| mean | 1.322727 | 2.543182 | 12000.3 | 5796.266 | 7951.277 | 3071.932 | 2881.493 | 1524.87 |
| std | 0.468052 | 0.774272 | 12647.33 | 7380.377 | 9503.163 | 4854.673 | 4767.854 | 2820.106 |
| min | 1 | 1 | 3 | 55 | 3 | 25 | 3 | 3 |
| 25% | 1 | 2 | 3127.75 | 1533 | 2153 | 742.25 | 256.75 | 408.25 |
| 50% | 1 | 3 | 8504 | 3627 | 4755.5 | 1526 | 816.5 | 965.5 |
| 75% | 2 | 3 | 16933.75 | 7190.25 | 10655.75 | 3554.25 | 3922 | 1820.25 |
| max | 2 | 3 | 112151 | 73498 | 92780 | 60869 | 40827 | 47943 |
Here, we can see that we have a lot of variation in the magnitude of the data. We can see that attributes like Channel and Region have low magnitude whereas variables like Fresh, Milk, Grocery, etc. have a high magnitude. This shows that there is a lot of variation in our data.
Since K-Means is a distance-based algorithm, this difference of magnitude can create a problem. So let's first bring all the variables to the same magnitude:
# Here we are standardizing the data using StandardScaler in sklearn
from sklearn.preprocessing import StandardScaler
scaler = StandardScaler()
data_scaled = scaler.fit_transform(data)

# statistics of scaled data
pd.DataFrame(data_scaled).describe()
Output:
| 0 | 1 | 2 | 3 | 4 | 5 | 6 | 7 | |
|---|---|---|---|---|---|---|---|---|
| count | 4.40E+02 | 4.40E+02 | 4.40E+02 | 440 | 4.40E+02 | 4.40E+02 | 4.40E+02 | 4.40E+02 |
| mean | 1.61E-17 | 3.44E-16 | -3.43E-17 | 0 | -4.04E-17 | 3.63E-17 | 2.42E-17 | -8.07E-18 |
| std | 1.00E+00 | 1.00E+00 | 1.00E+00 | 1.001138 | 1.00E+00 | 1.00E+00 | 1.00E+00 | 1.00E+00 |
| min | -6.90E-01 | ######## | -9.50E-01 | -0.7788 | -8.37E-01 | -6.28E-01 | -6.04E-01 | -5.40E-01 |
| 25% | -6.90E-01 | -7.02E-01 | -7.02E-01 | -0.57831 | -6.11E-01 | -4.80E-01 | -5.51E-01 | -3.96E-01 |
| 50% | -6.90E-01 | 5.91E-01 | -2.77E-01 | -0.29426 | -3.37E-01 | -3.19E-01 | -4.34E-01 | -1.99E-01 |
| 75% | 1.45E+00 | 5.91E-01 | 3.91E-01 | 0.189092 | 2.85E-01 | 9.95E-02 | 2.18E-01 | 1.05E-01 |
| max | 1.45E+00 | 5.91E-01 | 7.93E+00 | 9.18365 | 8.94E+00 | 1.19E+01 | 7.97E+00 | 1.65E+01 |
K-Means
The magnitude looks similar now. Next, let's create a K-Means function and fit it on the data:
# Here we are defining our K-Means function and we are initializing our cluster centres using K-Means++

K-Means = K-Means(n_clusters=2, init='K-Means++')

# fitting the k means algorithm on scaled data
K-Means.fit(data_scaled)
We have initialized two clusters. We have used the K-Means++ initialization which gives better results. Let's evaluate our clusters. To do that, we will calculate the inertia of the clusters. Inertia is the distance between the points in a cluster.
#inertia on the data
K-means.inertia_
We got an inertia value of almost 2600.
Finding Optimum Clusters
Now we will find the optimum number of clusters.
We will first fit multiple K-Means models and in each model, we will increase the number of clusters. We will store the inertia value of each model in a variable and then we will plot the result to find the optimum number of clusters.
# fitting multiple K-Means algorithms and storing the values in an empty list
SSE = []
for cluster in range(1,20):
    K-Means = K-Means(n_jobs = -1, n_clusters = cluster, init='K-Means++')
    K-Means.fit(data_scaled)
    SSE.append(K-Means.inertia_)

# converting the results into a dataframe and plotting them
frame = pd.DataFrame({'Cluster':range(1,20), 'SSE':SSE})
plt.figure(figsize=(12,6))
plt.plot(frame['Cluster'], frame['SSE'], marker='o')
plt.xlabel('Number of clusters')
plt.ylabel('Inertia')
Output:
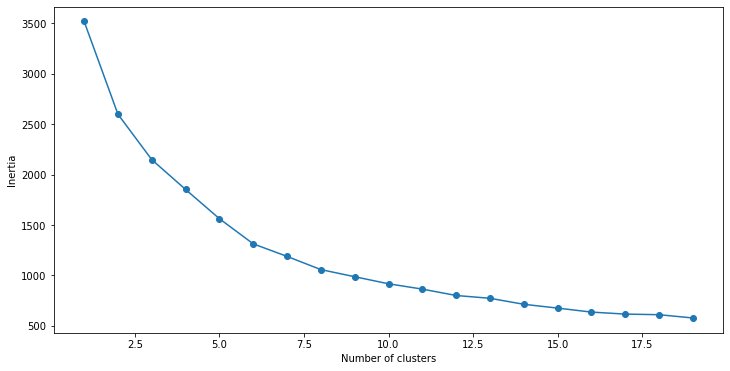
From the curve, we can see that the optimum number of clusters
# Now we are making our final K-Means function and initializing our cluster centres using K-Means++

K-Means = K-Means(n_jobs = -1, n_clusters = 5, init='K-Means++')
K-Means.fit(data_scaled)
pred = K-Means.predict(data_scaled)
Finally, let's look at the value count of points in each of the above-formed clusters:
frame = pd.DataFrame(data_scaled)
frame['cluster'] = pred
frame['cluster'].value_counts()
Output:
1    209
0    126
3     91
2     12
4      2
Name: cluster, dtype: int64
We can see that there are 126 data points belonging to cluster 1 (index 0), then 209 points in cluster 2 (index 1), and so on. We have now implemented K-Means Clustering in Python.
Conclusion
In this article, we learned about the K-Means clustering algorithm. We saw that where K-Means can be used in real life and we also saw how K-Means works. Then we learned about the initialization problem in K-Means which led us to know about K-Means++. Finally, we saw how clustering can be implemented using sklearn.