

Feature Scaling
Course Lessons
| S.No | Lesson Title |
|---|---|
| 1 | Introduction |
| 1.1 | Need for Feature Scaling |
| 1.2 | When to Scale Features? |
| 2 | Methods of Feature Scaling |
| 2.1 | Normalization |
| 2.2 | Standardization |
| 3 |
Feature Scaling Using Sklearn |
| 3.1 | Normalization |
| 3.2 | Standardization |
| 4 | Conclusion |
Introduction
The field of deep learning has gained a lot of attraction in the last few years. The most popular problems that are solved by deep learning models tend to use supervised deep learning models. For example, problems related to image recognition, speech recognition, sentiment classification are traditionally a part of supervised deep learning. The unsupervised models for deep learning are not commonly used or discussed like their counterparts (supervised models). There are many popular unsupervised models such as self-organizing maps (SOM), autoencoders, Deep Boltzmann machines (DBM) etc. In this article we'll keep our focus on autoencoders which have gained popularity in the last few years.
Need for Feature Scaling
The need for feature scaling can be understood by the following example.
Let us say that we have a dataset of house prices. The independent features contain the number of bedrooms, area (in square feet), etc. So, in general, the number of bedrooms would contain entries like 1,2,3, etc. And the area of the house in square feet would be 1200,1300,1450, etc. Now, as we keep on getting more and more features, they will have their own separate units and they will be scaled according to their own respective units. So there is no standard scaling in such data.
Many machine learning algorithms use Euclidean distance or some other distance function between two data points in their computations. This creates a problem as these algorithms only take into consideration the magnitude of features, not their units. So, the features with higher magnitude such as 'area(in square feet)" in the above example would weigh in a lot more than 'the number of bedrooms'.
In order to overcome this problem, we apply feature scaling.
When to Scale Features?
In most cases, whenever we use an algorithm that computes distance or assumed normality, we should scale our features.
Below are some examples where feature scaling is necessary.
- KNN computes the distance between data points, so it is sensitive to the magnitudes of features. Thus it should be scaled so that all features can weigh in equally.
- Principal Component Analysis(PCA) tries to get the features that have maximum variance and the variance is high for features that have high magnitude. Thus feature scaling is important in PCA too.
- Gradient Descent can speed up by feature scaling. This is because theta will descend quickly on small ranges and slowly on large ranges, so it will oscillate inefficiently down to the optimum value when the variables are uneven.
Methods of Feature Scaling
Feature scaling can be done in mainly 2 ways which are normalization and standardization.
Let us look at them in detail.
Normalization
In normalization, we shift and rescale our values in such a way that they end up in the range 0 and 1. Normalization is also called MinMax scaling.
Normalization is beneficial when our data has varying scales and our algorithm does not depend on the distribution of our data, like distance-based algorithms (KNN, SVM, etc)
Formula for normalization:
X'= (X - X.min(axis=0)) / (X.max(axis=0) - X.min(axis=0))
where Xmin and Xmax are the minima and maxima values of X respectively.
Let us look at normalization in the form of code.
#Here we are importing all the necessary libraries

import numpy as np
import pandas as pd
import matplotlib.pyplot as plt

#Here we are reading our X(independent feature) data and
#storing it in a variable named df
#then we are showing the first 5 rows of our data.

df=pd.read_csv('Xdata.csv')
x=df.values
df.head()
Output:
    9.1
0   8.0
1   9.1
2   8.4
3   6.9
4   7.7
#Here we are reading our Y(dependent feature) data and storing it in a variable named Y and then we are showing the first 5 rows of our data.

Y=pd.read_csv('Ydata.csv')
y=Y.values
Y.head()
Output:
    0.99523
0   0.99007
1   0.99769
2   0.99386
3   0.99508
4   0.99630
Now let us plot this data.
#We are using the scatter method inside matplotlib.pyplot to plot our data.
plt.style.use('seaborn')
plt.scatter(x,y)
plt.show()
Output:
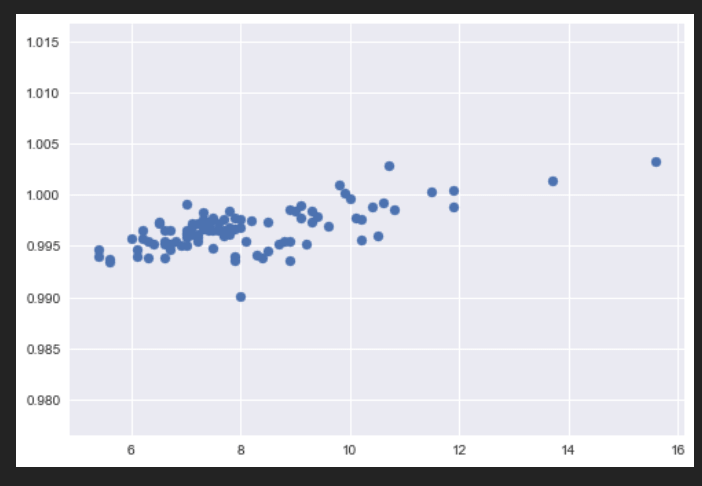
As we can see there is a lot of variation in our data.
Let us now use normalization to scale this data.
#Here we are using the above formula to normalize our data.
#After that we are plotting this new data(having color red) alongisde the previous data in order to see the difference.

x2 = (x - x.min(axis=0)) / (x.max(axis=0) - x.min(axis=0))
plt.style.use('seaborn')
plt.scatter(x2,y,color='red')
plt.scatter(x,y)
plt.show()
Output:
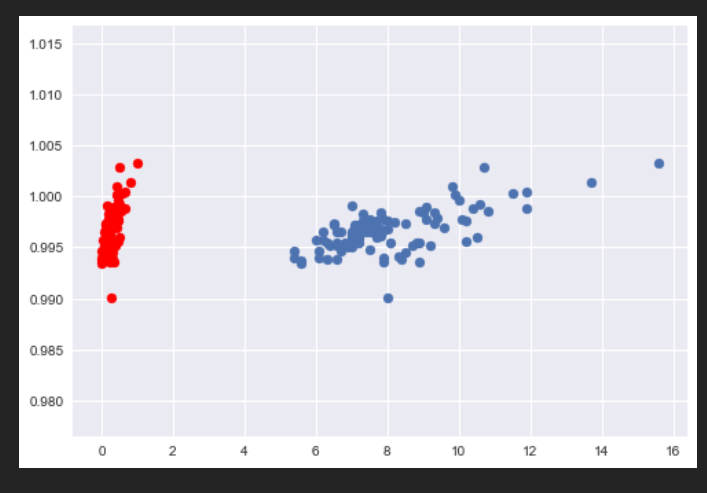
As we can see, our data after normalization(which is shown in red) is now scaled appropriately. All the values in our normalized data lie between 0 and 1.
Standardization
Standardization is a feature scaling technique where the values are centered around the mean with a standard deviation of 1. This means that the mean of the attribute will become 0 and the new distribution will have a standard deviation of 1.
Formula for standardization:
X'=X-mean(X)/std(X)
Let us take the above example and standardize our data.
#Here we are using the above formula to standardize our data.
#After that we are plotting this new data(having color red) alongisde the original data in order to see the difference.

x3=(x-x.mean())/x.std()
plt.style.use('seaborn')
plt.scatter(x3,y,color='red')
plt.scatter(x,y)
plt.show()
Output:
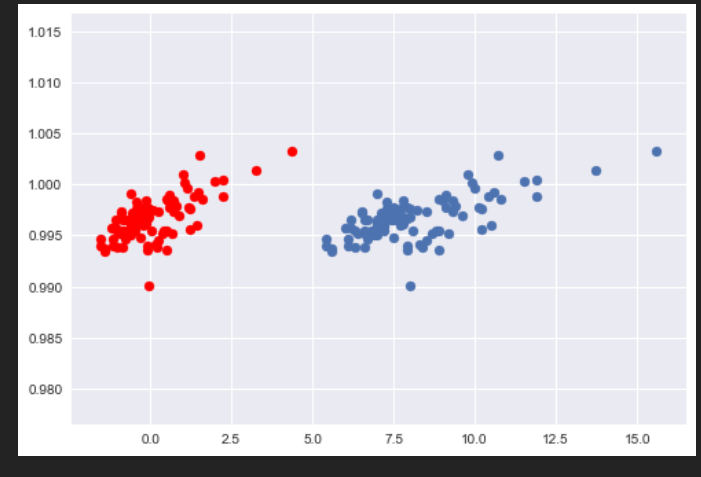
As we can see our standardized data(red) has a mean of 0 and a standard deviation of 1.
Feature Scaling Using Sklearn
The above results can also be obtained using sklearn.
Normalization
For normalization, Sklearn has the Minmax Scaler function from the Sklearn library.
#Here we are importing the MinMaxScaler from Sklearn
#Then we are normalizing our data using fit_transform
#then we are plotting it alongside our original data.

from sklearn.preprocessing import MinMaxScaler
scaler = MinMaxScaler()
z=scaler.fit_transform(x)
plt.style.use('seaborn')
plt.scatter(z,y,color='red')
plt.scatter(x,y)
plt.show()
Output:

As we can see, we got the same output as we had when we implemented MinMaxScaler from Scratch.
Standardization
For Standardization, we have the StandardScaler function from the Sklearn library.
#Here we are importing the StandardScaler from Sklearn
#Then we are standardizing our data using fit_transform and then we are plotting it alongside our original data.

from sklearn.preprocessing import StandardScaler
scaler = StandardScaler()
z=scaler.fit_transform(x)
plt.style.use('seaborn')
plt.scatter(z,y,color='red')
plt.scatter(x,y)
plt.show()
Output:

As we can see, our output is the same as we had when we implemented StandardScaler from scratch.
Conclusion
In this article, we learned what is feature scaling and why do we need to scale our data before feeding it to any algorithm. Also, we have discussed the different feature scaling techniques. We implemented normalization and standardization from scratch and also using MinMax and StandardScaler in Sklearn. Happy Learning!