

DBSCAN

Course Lessons
| S.No | Lesson Title |
|---|---|
| 1 | Introduction |
| 1.1 | Applications |
| 1.2 | Need for DBSCAN |
| 2 | Human Brain |
| 2.1 | Parameters |
| 2.2 | Working of DBSCAN |
| 2.3 | Parameter Selection in DBSCAN Clustering |
| 3 |
Implementation |
| 3.1 | Importing and Preprocessing Dataset |
| 3.2 | Model Creation |
| 4 |
Advantages and Disadvantages of DBSCAN |
| 4.1 | Advantages |
| 4.2 | Disadvantages |
| 5 | Conclusion |
Introduction
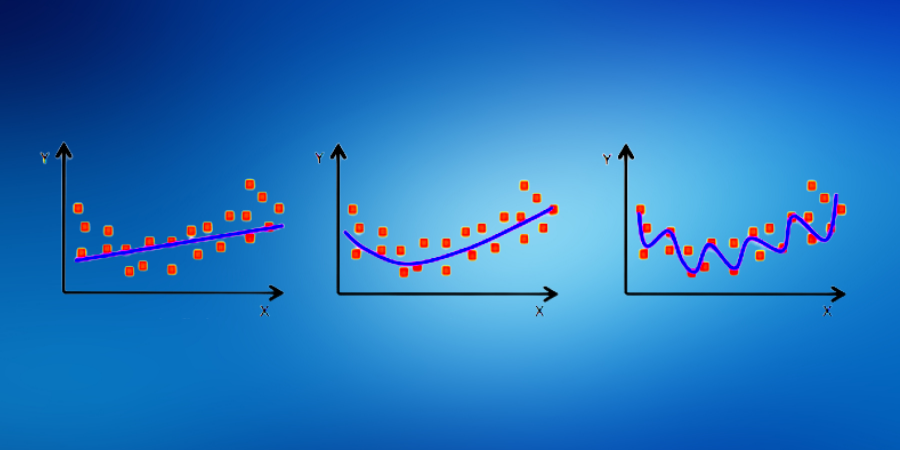
Clustering is an unsupervised learning technique where we attempt to cluster the points together on the basis of some characteristics. There are several clustering algorithms. Amongst them, Hierarchical and K-Means clustering are widely used.
Applications
Below is a list of some of the applications of clustering:
- Document Classification
- Recommendation Engine
- Image Segmentation
- Market Segmentation
- Search Result Grouping
- Anomaly Detection
All the above problems require clustering to solve them. Hence it is necessary to understand the concept of clustering.
Need for DBSCAN
K-Means and Hierarchical Clustering cannot create clusters of random shapes. They are unable to perform clustering wherein densities vary. This is the reason that we need DBSCAN clustering. Below is an example that will help us understand why we need DBSCAN. We have data points that are densely present in the form of concentric circles.
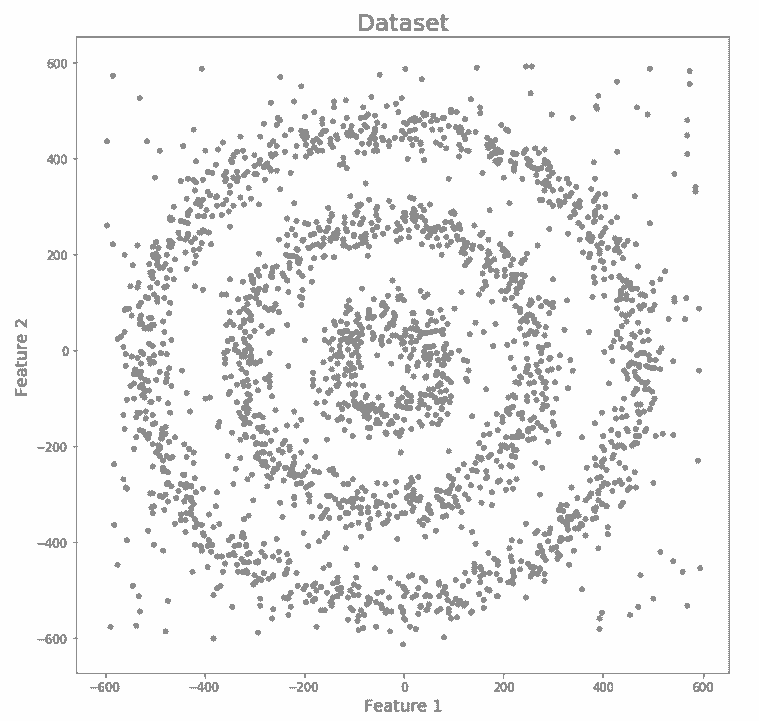
We can clearly see that there are three different clusters which are in the form of concentric circles. Let us now run K-Means and Hierarchical clustering algorithms and will see how well they can cluster this data.
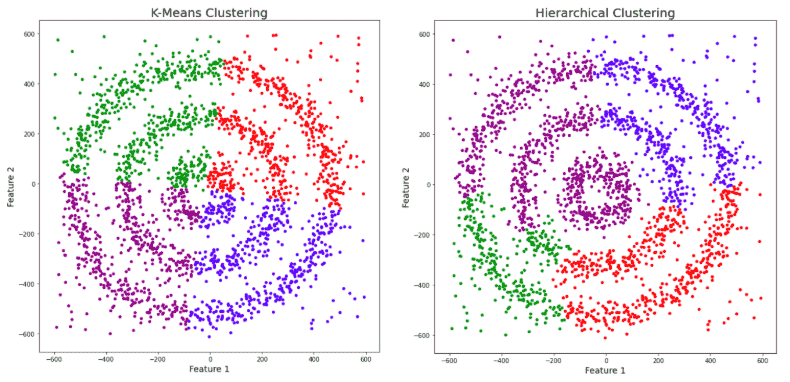
The data has noise and we have given a unique color to it. We can clearly see that both K-Means and Hierarchical clustering fail to cluster our data in the form of concentric circles and they are unable to separate the noise from the data. Now let us see how DBSCAN performs.
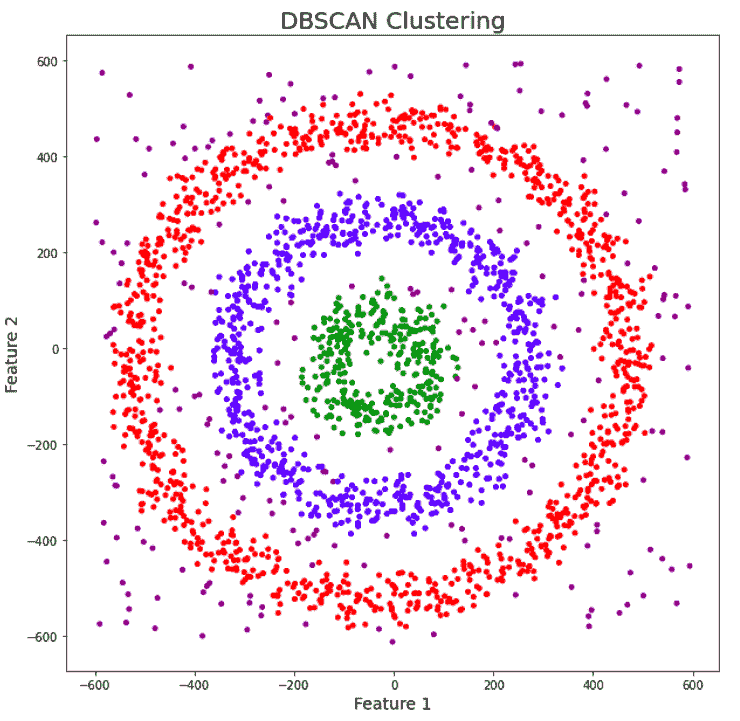
We can notice that DBSCAN accurately clusters the data points including the noise.
DBSCAN Clustering
DBSCAN stands for Density-Based Spatial Clustering of Applications with Noise. DBSCAN is a density-based clustering algorithm and it works on the assumption that clusters are dense regions that are surrounded by less dense regions. It tries to group the data points which are densely packed together into a single cluster. DBSCAN is able to detect clusters in a large spatial dataset, by looking at the local density of the data points. DBSCAN can also handle outliers. Unlike K-Means we do not need to provide the number of clusters beforehand.
Parameters
We only need to define 2 parameters in DBSCAN which are epsilon and minPoints.
epsilon: It is the radius of the circle which is to be formed around each point so that we can check the density.
minPoints: It is the minimum number of data points that are required to be inside the circle so that the data point can be classified as a core point.
Working of DBSCAN
Let us understand how DBSCAN works using the below example.

Here, we have some data points. Let us understand how DBSCAN will cluster these points.
DBSCAN will create a circle that will have a radius of epsilon around every data point and it will classify them into core point, border point, and noise. A data point is classified as a core point if the circle which is formed around it contains at least a 'minPoints' number of points. If the number of points is less than minPoints, then it is classified as border Point, and if there are no other data points around any data point within epsilon radius, then it treated as noise.
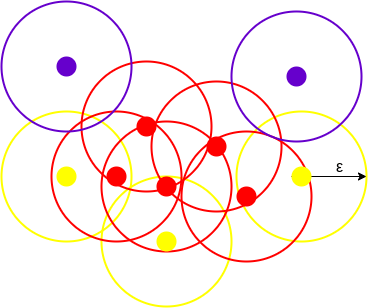
In the above figure, we can see the clusters created using DBSCAN with minPoints = 3. Here, we have drawn a circle of radius=epsilon around every data point. Using these 2 parameters spatial clusters are created.
All the data points which have at least 3 points in the circle including itself are categorized as core points. The core points are represented using red color. All the data points which have less than 3 but more than 1 point in the circle including itself are categorized as border points. All the border points are represented using yellow color. The data points with no point other than itself present inside the circle are considered as noise. The noise is represented by the purple color. For finding the data points, DBSCAN uses Euclidean Distance.
Parameter Selection in DBSCAN Clustering
DBSCAN is sensitive to the values of epsilon and minPoints. Hence, we need to choose these parameters carefully. The value of minPoints should be at least one more than the number of dimensions of the dataset, i.e.,
minPoints >= Dimensions+1
It is not logical to take minPoints as 1 as it will lead to each point is a separate cluster. Therefore, it should at least be 3. In most cases, it is taken as twice the number of dimensions. But domain knowledge also decides its value.
We can decide the value of epsilon using the K-distance graph. The point which has the maximum curvature in the graph will be the value of epsilon. If the value of epsilon that we have chosen is too small then more clusters will be created. But, if we take an epsilon value that is too big then many small clusters might merge into a big cluster.
Implementation
Here we are creating a sample dataset using scikit-learn. After creating this dataset we will normalize our data. It is important to normalize our data as it makes it easier to find an appropriate epsilon value.
Importing and Preprocessing Dataset
Let us import the libraries we need for this.
#Here we are importing all the libraries that we need in order to implement DBSCAN.

import numpy as np
from sklearn.datasets import make_blobs
from sklearn.preprocessing import StandardScaler
import matplotlib.pyplot as plt
%matplotlib inline
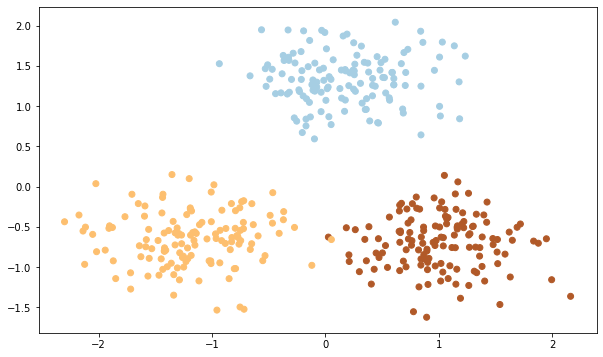
We will be creating a dataset that would have 3 clusters with and a standard deviation of 0.5 for each cluster. We are taking 400 samples and we also assign three points as the center of the clusters.
#Here we are visualizing our dataset

plt.figure(figsize=(10,6))
plt.scatter(X[:,0], X[:,1], c=y, cmap='Paired')
plt.show()
Model Creation
Now we can create our DBSCAN model in order to determine our clusters.
#Here we are importing the DBSCAN model from sklearn. We using the epsilon value as 0.4 and min_samples values as 20

from sklearn.cluster import DBSCAN
db = DBSCAN(eps=0.4, min_samples=20)
db.fit(X)
We only have to define eps and min_samples parameters. We do not have to specify the number of clusters like in K-Means.
Let us now visualize the clusters which were determined by DBSCAN:
#Here we are plotting the clusters which were made determined using DBSCAN

y_pred = db.fit_predict(X)
plt.figure(figsize=(10,6))
plt.scatter(X[:,0], X[:,1],c=y_pred, cmap='Paired')
plt.title("Clusters determined by DBSCAN")
plt.show()
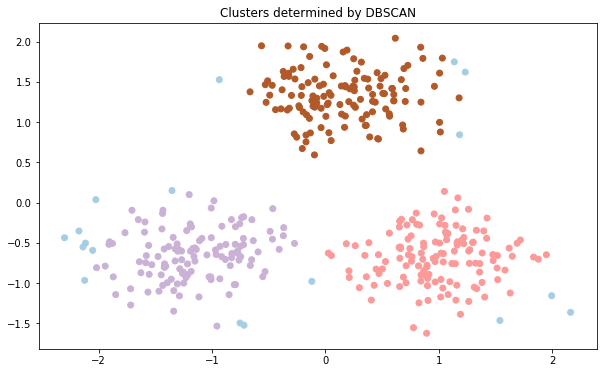
DBSCAN was able to accurately detect the outliers which are marked with blue color. We can see the labels of data points using the labels attribute. Noise is given a -1 label. Let us see the number of outliers in our dataset:
#Here we are seeing how many outliers we have in our dataset

db.labels_[db.labels_ == -1].size
Output: 18
As we can see that DBSCAN performed very well at finding the outliers which would not be an easy task if we used a partition-based algorithm like K-Means.
Advantages and Disadvantages of DBSCAN
Advantages
- In DBSCAN, we do not have to give the number of clusters that we want to form.
- This algorithm performs well with clusters of arbitrary shapes.
- DBSCAN is able to detect outliers.
Disadvantages
- It is not an easy task to find the right number of neighborhoods(eps) and it also requires domain knowledge.
- If the clusters have very different densities then DBSCAN is not well suited to define those clusters. The clusters are defined using the combination of eps and minPts parameters. Since we have to pass one eps and minPts combination to our algorithms, it is not able to generalize the clusters which have very different densities
Conclusion
In this article, we have gone through the working of the DBSCAN algorithm. We have also understood and compared the significance of the DBSCAN algorithm with other clustering algorithms such as K-Means. Further, we have implemented and demonstrated the efficacy of the DBSCAN algorithm using sklearn.